Statistics from the Fevermap POC trial
Fevermap development started in mid-March 2020 in response to the spreading COVID-19 pandemic. The version 1.0 was launched on March 31st, in just a few weeks, which in itself is an impressive figure and shows how good the team behind Fevermap is on delivering. Unfortunately none of the discussions with various authorities form different countries resulted in funding or commitment to using Fevermap for situational awareness on any region, so development was halted and the proof-of-concept put on halt in July 2020.
As a small retrospect, we decided to publish some key figures from the trial app we run to prove that the technology works.
Development
The development was extremely intense and fast, yet we kept following software development best practices to keep the code quality high. After the first initial commits all changes went in via 178 merge requests and code reviews by humans and 681 continuous integration pipeline runs.
On Gitlab we had 157 issues filed, which of 90 are now closed. There are still 67 issues open, which document some feature requests and future design ideas, but the core application was completed. There were 25 members added to the Gitlab project who with elevated privileges while many tens of users with just regular Gitlab accounts participated in the discussions in the issues.
 Fevermap code repository commits
In total there was 39 developers who landed 495 commits on the master branch, and thousands more on development branches. Full git summary for all authors listed by number of commits:
 218	Matsuuu                    44.0%
 123	Otto Kekäläinen            24.8%
  47	Ilkka Tengvall             9.5%
  20	Tero Ahonen                4.0%
  14	Frej Bjon                  2.8%
  13	Gunnar Oledal              2.6%
  10	HACKING-STATION\gunhaxxor  2.0%
   9	Gergely Csatari            1.8%
   5	Henry Kulmala              1.0%
   4	Olli Savisaari             0.8%
   2	Dixon Siu                  0.4%
   2	Serge Serebro              0.4%
   2	Vitaly Repin               0.4%
   1	Aleksis Karme              0.2%
   1	Anton Volokha              0.2%
   1	ArchFeh                    0.2%
   1	Artur Iwicki               0.2%
   1	Bastien                    0.2%
   1	Be Svnd                    0.2%
   1	Charly Molter              0.2%
   1	Chayut Takaweekaew         0.2%
   1	Eduardo Suarez-Santana     0.2%
   1	Fareh Abdelhak             0.2%
   1	Gearoid Hynes              0.2%
   1	Juergen E. Fischer         0.2%
   1	Kia Itanen                 0.2%
   1	Leonel Salazar Videaux     0.2%
   1	Marie-Pierre               0.2%
   1	Martin von Willebrand      0.2%
   1	Nico Rikken                0.2%
   1	Niels Swinkels             0.2%
   1	Petri Salminen             0.2%
   1	R.Sicart                   0.2%
   1	Radek Čegan                0.2%
   1	Taylor Thompson            0.2%
   1	Thorsten Scherer           0.2%
   1	Vincenzo Barranco          0.2%
   1	reivaj                     0.2%
   1	willebra                   0.2%
Marketing
 Fevermap.net pageviews in 2020
- 1100 people subscribed early on to our mailing list and constituted our initial pool of test users and contributors
- Our most popular video got over 1300 views on Youtube since it was posted during the Hack The Crisis Finland hackathon
- Our website has had so far over 24 thousand page views, with 73% of visitors from Finland, 10% from the USA and the rest from all over the world
- Our social media presence gained us at least 3000 visitors
Many more thousands came from the many news articles posted about us:
- Mediuutiset: Ilmoita oletko terve vai sairas – Suomalainen mobiilisovellus kerää 14 kielellä tietoa koronatilanteesta
- Iltalehti: Suomalainen koronan seurantaan tehty sovellus on käännetty jo 14 kielelle
- Tivi: Suomalainen koronasovellus menee maailmalla kuumille kiville: tehtiin 2 päivässä ja käännettiin jo 11 kielelle – kaikki voivat auttaa, näin se toimii
- Turun Sanomat: Suomalainen kännykkäsovellus seuraa pian koronatartuntoja reaaliajassa
- Kauppalehti: Suomalainen koronasovellus tehtiin 2 päivässä ja käännettiin jo 11 kielelle
- Good News From Finland: Fevermap supports health authorities with data
- YLE: Koronavirus teki puhelimesta vahdin ja varoittajan – Pandemia on nostanut ihmisten valvonnan uudelle tasolle
- Mobiili.fi: Suomalaistiimi kehitti koronatilanteen seurantaan Fevermap-palvelun – käännetty jo 14 eri kielelle
- Kotimikro: Valtiot ja yritykset jäljittävät sovelluksella covid-19-tartunnan saaneita
- The New Stack: How a Hackathon COVID-19 App Was Ported to OpenShift
- Geospatial World: Finnish app Fevermap helps track COVID cases in real time
- Computer Weekly: Coronavirus: Nordic authorities use tech in fight against Covid-19
A majority of the visibility in Finland came through our two press releases in Finnish:
We also gained a lot of visibility though collaboration with similar efforts and by being included in various listings on the topic:
- MyData.org: An approach for fighting COVID-19 and beyond
- LibrePlanet HACKERS and HOSPITALS listing
- Startup Blink: Coronavirus Innovation Map directory of projects
- Help with COVID directory of projects
Adoption
The application itself at app.fevermap.net was launched on March 30th. It was a progressive web application (PWA), which means anybody can use it on any browser on any desktop or mobile immediately from day 1. On mobile phones the user experience equals that of an mobile application without the complexity of app stores and such.
 Pageviews on app.fevermap.net in 2020
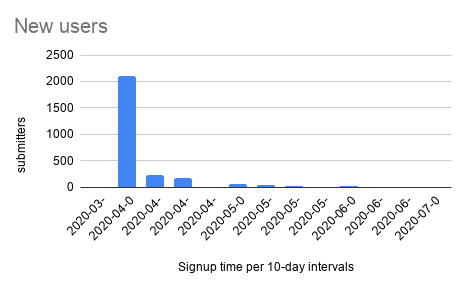
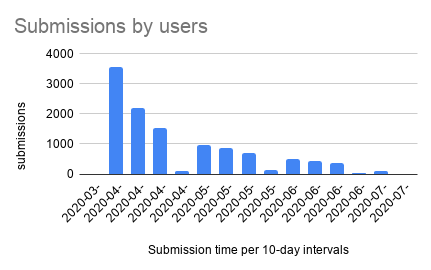
We quickly gained a lot of users. All in total there were 2686 unique devices running the Fevermap, which sent 11 481 submissions. Most of the users came in April and we quickly reached the goal we had for the proof-of-concept. We never intended to run everything ourselves, but just to prove that the technology works and then find authorities who would like to apply Fevermap in their own region to gain situational awareness.


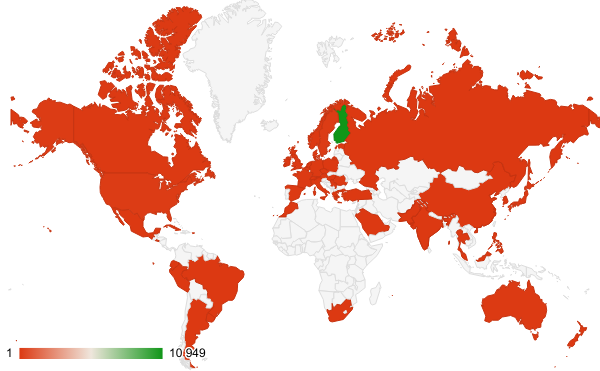
As the core developer are from Finland and as our project got most of its visibility in Finland, the majority of users and hence also submissions were from Finland. There was however participants in total from 49 countries.

Unfortunately none of our intended collaborations lead to any authority actually wanting to have the situational awareness Fevermap could have provided, so efforts (and thus also usage) started to drop after April until in July we officially ended the POC.
Projects building on Fevermap
- Feberkarta.se, Sweden
- MyCovidSymptoms.ie, Ireland
- SafeCommute/CrowdTracker, Australia
- COVIDstoplight, USA/Chicago
What did the proof-of-concept demonstrate?
We can safely conclude that: * The PWA architecture was quick to develop, did not have any major technical challenges we were not able to quickly overcome and the overall system has a 100% availability throughout the PoC lifetime. * The whole development workflow and pipeline kept up the software quality despite a high development velocity, and we we able to successfully roll out 17 new releases and deliver our users daily improvements. * The code base was well designed, implemented and documented. The fact that others around the world forked Fevermap and built their own versions on top of it is clear evidence of those traits. * There was clearly a demand for this type of solution, and the fact that no real use by any authority never materialized was not due to flaws in the solution, but more to be attributed to how slow government agencies are in general and how their decisions follow other tracks than straightforward technology adoption or partnerships with other than established government vendors. * The decision to build the app as open source software opened more doors than it closed for us, and since all COVID-19 with wide-spread adoption ever since are based on open source, it is clearly the correct approach for transparency and trustworthiness for this kind of software now and in the future.
What’s next?
The Fevermap is still a viable solution for situational awareness. Right now the project is hibernating, but it can come active on a short notice if the need arises. What in particular differentiates Fevermap from other COVID-19 apps is that Fevermap actually isn’t specific for COVID-19 in any way. As it is intended to monitor the fever prevalence in a population, it can be useful for any infectious disease we know of now as they pretty much all include fever as one of the main symptom. The Fevermap can also have a special niche in developing countries where COVID-19 testing is too expensive and statistics about fever might be the only option to have any overview of the spread of a disease.
